This example was automatically generated from a Jupyter notebook in the RxInferExamples.jl repository.
We welcome and encourage contributions! You can help by:
- Improving this example
- Creating new examples
- Reporting issues or bugs
- Suggesting enhancements
Visit our GitHub repository to get started. Together we can make RxInfer.jl even better! 💪
Latent Vector Autoregressive Model
This is an experimental example of a Latent Vector Autoregressive Model (LVAR).
using RxInfer, Random, LinearAlgebraAt first let us define auxiliary functions for priors, c and b variables
function generate_ar_process(order, θ, n_samples; σ²=1.0)
    x = zeros(n_samples)
    # Initialize with random noise
    x[1:order] = randn(order) * sqrt(σ²)

    for t in (order+1):n_samples
        # AR equation: x[t] = θ₁x[t-1] + θ₂x[t-2] + ... + θₚx[t-p] + ε[t]
        x[t] = sum(θ[i] * x[t-i] for i in 1:order) + randn() * sqrt(σ²)
    end
    return x
end

# Set random seed for reproducibility
Random.seed!(42)

# Define orders for each process
orders = 5 .* ones(Int, 20)
n_samples = 120
n_missing = 20

n_ar_processes = length(orders)
processes = []

# Generate AR parameters and data for each process
for (i, order) in enumerate(orders)
    # Generate stable AR parameters (using a simple method)
    θ = 0.5 .^ (1:order)  # This ensures stability by having decreasing coefficients

    # Generate the AR process
    x = generate_ar_process(order, θ, n_samples)
    push!(processes, x)
end

# Convert to the format needed for the model
true_data = [[processes[j][i] for j in 1:n_ar_processes] for i in 1:n_samples]
observations = Any[[true_data[i][j] .+ randn() for j in 1:n_ar_processes] for i in 1:n_samples]

training_set = deepcopy(observations[1:n_samples-n_missing])

# Extend observations with missing values
for i in n_samples-n_missing:n_samples
    push!(training_set, missing)
end
function form_priors(orders)
priors = (x = [], γ = [], θ = [])
for k in 1:length(orders)
push!(priors[:γ], GammaShapeRate(1.0, 1.0))
push!(priors[:x], MvNormalMeanPrecision(zeros(orders[k]), diageye(orders[k])))
push!(priors[:θ], MvNormalMeanPrecision(zeros(orders[k]), diageye(orders[k])))
end
return priors
end
function form_c_b(y, orders)
c = Any[]
b = Any[]
for k in 1:length(orders)
_c = ReactiveMP.ar_unit(Multivariate, orders[k])
_b = zeros(length(y[1])); _b[k] = 1.0
push!(c, _c)
push!(b, _b)
end
return c, b
endform_c_b (generic function with 1 method)Next, we define a sub-model for a single AR-process
@model function AR_sequence(x, index, length, priors, order)
    γ ~ priors[:γ][index]
    θ ~ priors[:θ][index]
    x_prev ~ priors[:x][index]
    for i in 1:length
        x[index, i] ~ AR(x_prev, θ, γ) where {
            meta = ARMeta(Multivariate, order, ARsafe())
        }
        x_prev = x[index, i]
    end
end
Next, we define a tricky dot sequence
@model function dot_sequence(out, k, i, orders, x, c, b)
    if k === length(orders)
        out ~ b[k] * dot(c[k], x[k, i])
    else
        next ~ dot_sequence(k = k + 1, i = i, orders = orders, x = x, c = c, b = b)
        out  ~ b[k] * dot(c[k], x[k, i]) + next
    end
end
And here is our final model spec
@model function LVAR(y, orders)

    priors   = form_priors(orders)
    c, b     = form_c_b(y, orders)
    y_length = length(y)

    local x # `x` is being initialized in the loop within submodels
    for k in 1:length(orders)
        x ~ AR_sequence(index  = k, length = y_length, priors = priors, order  = orders[k])
    end

    τ ~ GammaShapeRate(1.0, 1.0)
    for i in 1:y_length
        μ[i] ~ dot_sequence(k = 1, i = i, orders = orders, x = x, c = c, b = b)
        y[i] ~ MvNormalMeanScalePrecision(μ[i], τ)
    end
end
@constraints function lvar_constraints()
for q in AR_sequence
# This requires patch in GraphPPL though, see https://github.com/ReactiveBayes/GraphPPL.jl/issues/262
# A workaround is to use `constraints = MeanField()` in the `infer` function and initializing `q(x)` instead of `μ(x)`
q(x, x_prev, γ, θ) = q(x, x_prev)q(γ)q(θ)
end
q(μ, τ) = q(μ)q(τ)
endlvar_constraints (generic function with 1 method)@initialization function lvar_init(orders)
# This is a problem still
for init in AR_sequence
q(γ) = GammaShapeRate(1.0, 1.0)
q(θ) = MvNormalMeanPrecision(zeros(orders[1]), diageye(orders[1])) # `orders[1]` is sad... needs to be fixed
end
q(τ) = GammaShapeRate(1.0, 1.0)
μ(x) = MvNormalMeanPrecision(zeros(orders[1]), diageye(orders[1]))
endlvar_init (generic function with 1 method)mresult = infer(
model = LVAR(orders = orders),
data = (y = training_set, ),
constraints = lvar_constraints(),
initialization = lvar_init(orders),
returnvars = KeepLast(),
options = (limit_stack_depth = 100, ),
showprogress = true,
iterations = 30,
)Inference results:
Posteriors | available for (μ, τ, x)
Predictions | available for (y)## Plot results
using Plots
theme(:default)
combined_plot = plot(layout = (3, 1), size = (600, 800), legend = :topleft)
# Plotting options
marker_alpha = 0.7
marker_size = 5
ribbon_alpha = 0.3
observation_color = :green
# Define the training range indices
train_indices = 1:(n_samples - n_missing)
# Extract observations for the training range
train_observations = observations[train_indices]
# Plot for index 5 (Subplot 1)
index = 5
plot!(combined_plot[1], getindex.(mean.(mresult.predictions[:y][end]), index), ribbon = getindex.(diag.(cov.(mresult.predictions[:y][end])), index), fillalpha=ribbon_alpha, label = "Inferred $(index)")
plot!(combined_plot[1], getindex.(true_data, index), label = "True $(index)")
# Plot only existing observations using train_indices as x-values
scatter!(combined_plot[1], train_indices, getindex.(train_observations, index), label = "Observations $(index)", marker=:xcross, markeralpha=marker_alpha, markersize=marker_size, color=observation_color)
vline!(combined_plot[1], [n_samples-n_missing], label="training/test split", linestyle=:dash, color=:black)
plot!(combined_plot[1], title = "LVAR $(index)")
# Plot for index 10 (Subplot 2)
index = 10
plot!(combined_plot[2], getindex.(mean.(mresult.predictions[:y][end]), index), ribbon = getindex.(diag.(cov.(mresult.predictions[:y][end])), index), fillalpha=ribbon_alpha, label = "Inferred $(index)")
plot!(combined_plot[2], getindex.(true_data, index), label = "True $(index)")
# Plot only existing observations
scatter!(combined_plot[2], train_indices, getindex.(train_observations, index), label = "Observations $(index)", marker=:xcross, markeralpha=marker_alpha, markersize=marker_size, color=observation_color)
vline!(combined_plot[2], [n_samples-n_missing], label="", linestyle=:dash, color=:black) # No label for subsequent vlines
plot!(combined_plot[2], title = "LVAR $(index)")
# Plot for index 20 (Subplot 3)
index = 15
plot!(combined_plot[3], getindex.(mean.(mresult.predictions[:y][end]), index), ribbon = getindex.(diag.(cov.(mresult.predictions[:y][end])), index), fillalpha=ribbon_alpha, label = "Inferred $(index)")
plot!(combined_plot[3], getindex.(true_data, index), label = "True $(index)")
# Plot only existing observations
scatter!(combined_plot[3], train_indices, getindex.(train_observations, index), label = "Observations $(index)", marker=:xcross, markeralpha=marker_alpha, markersize=marker_size, color=observation_color)
vline!(combined_plot[3], [n_samples-n_missing], label="", linestyle=:dash, color=:black) # No label for subsequent vlines
plot!(combined_plot[3], title = "LVAR $(index)")
# Display the combined plot
combined_plot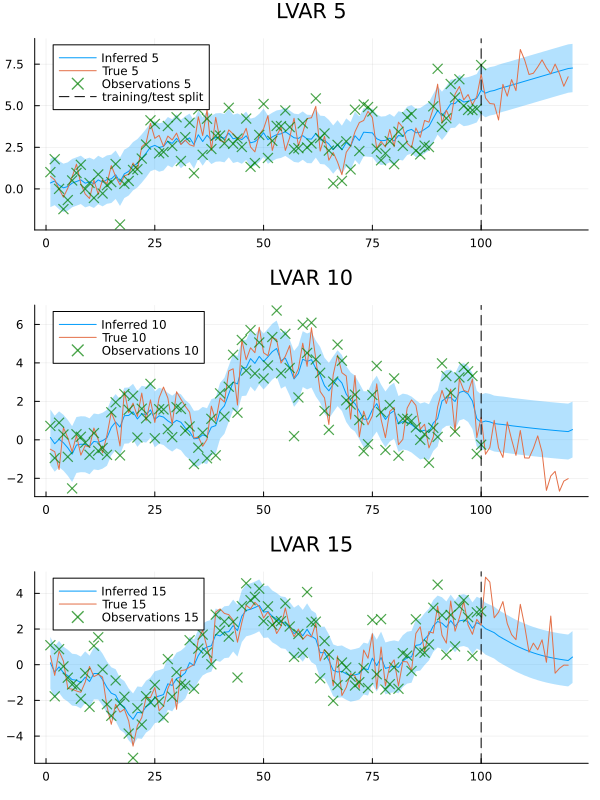
This example was automatically generated from a Jupyter notebook in the RxInferExamples.jl repository.
We welcome and encourage contributions! You can help by:
- Improving this example
- Creating new examples
- Reporting issues or bugs
- Suggesting enhancements
Visit our GitHub repository to get started. Together we can make RxInfer.jl even better! 💪
This example was executed in a clean, isolated environment. Below are the exact package versions used:
For reproducibility:
- Use the same package versions when running locally
- Report any issues with package compatibility
Status `/tmp/jl_psgPRK/Project.toml`
  [91a5bcdd] Plots v1.41.6
  [86711068] RxInfer v5.5.0
  [37e2e46d] LinearAlgebra v1.12.0
  [9a3f8284] Random v1.11.0